|
From the USGS National Earthquake Information Center:
On January 26 2001, a major earthquake
occurred IN GUJARAT, INDIA about 65 miles (110 km) north-northeast
of Jamnagar, India or about 180 miles (290 km) southeast
of Hyderabad, Pakistan at 8:16 PM MST today, Jan 25, 2001 (Jan 26
at 8:46 AM local time in India). A PRELIMINARY
MAGNITUDE OF 7.9 WAS COMPUTED FOR THIS EARTHQUAKE. The magnitude
and location may change slightly as additional
data are received from other seismograph stations. According to
preliminary reports, some buildings collapsed in the state of
Gujarat. The earthquake was felt at Mumbai (Bombay) and Delhi, as
well as Karachi and Peshawar, Pakistan and in parts of
Nepal. On June 16, 1819 an earthquake in this same general area
killed 1500-2000 people.
This quake was similar in magnitude to the Turkish quake in
August 1999, and the prediction in this case was based on the striking
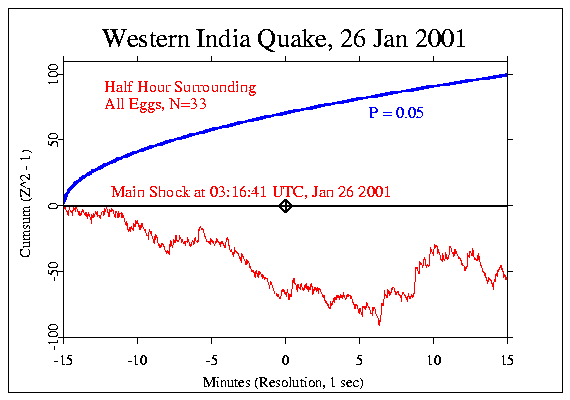
outcome for the earlier quake. The period beginning 15 minutes before
the actual event, continuing to 15 minutes after was taken as the formal
data segment. In this case, the sharp upswing prior to the main shock
was not found, and the
Chisquare for the half-hour period was 1746 on 1800 degrees of freedom
for a p = 0.815.
See below for pseudorandom control for the formal event.

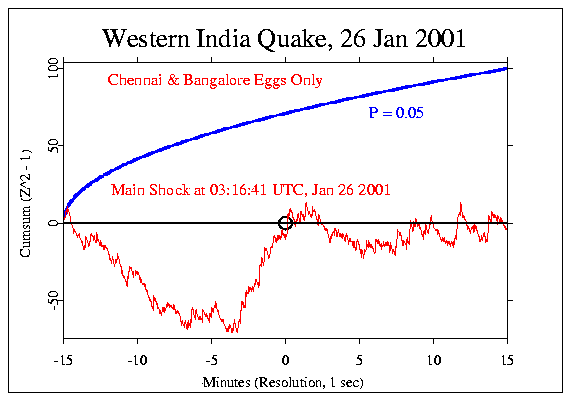
There are two active eggs in India, and their data do
show a sharp upswing starting about four minutes before the quake. This
four-minute period has a Chisquare of 302.7 on 240 df for a probability
of p = 0.004.

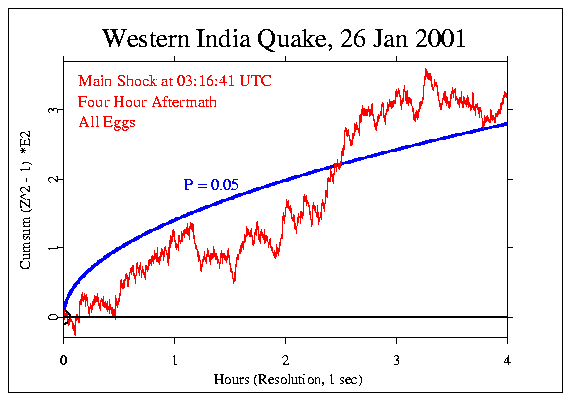
Finally, the four-hour aftermath of the West India quake shows a very
strong deviation in the data from all eggs in the GCP network. It is
sufficiently consistent that the trend reaches a significance level or
odds ratio of 3 in 100. The Chisquare is 14718 on 14400 degrees of
freedom, corresponding to a p = 0.031.

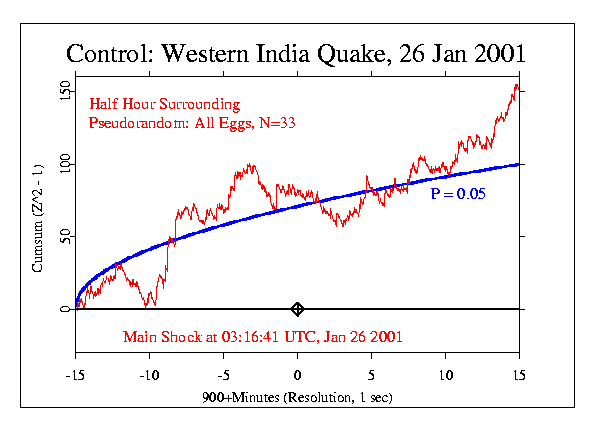
A control comparison,
using corresponding data from a pseudorandom source, has Chisquare
1951.7
on 1800 df and p = 0.007. In contrast to the real data, which showed no
effect, we have in this case a striking result for the control
data. The following graph
displays the cumulative deviation of the pseudorandom data.

|