|
From the BBC:
A harrowing 8.9 earthquake hit Japan tonight. The New York
Times reports: "A tsunami hit the coast of northeast Japan
on Friday in the aftermath of an 8.9 magnitude earthquake
about 80 miles offshore. Television images showed waves of
more than 12 feet roaring inland. CNN reported that air and
land transportation was severely disrupted."
The quake struck at 2:46 p.m. Tokyo time just off
Honshu, "Japan's most populous island."
An estimated 4 million people are without power.
According to BBC, the following tsunami caused "caused
extensive damage" with residents trapped inside their
buildings. "Japan's TV showed cars, ships and even buildings
being swept away" and "wave as high as 6m (20ft)" could hit
the coast.
To give you perspective on the gravity of the Japanese
earthquake, the Loma Prieta quake measured 6.9 and the Great
San Francisco Quake of 1906 measured 7.9. Today's quake is
one of the largest five recorded since 1900.
No word yet on number of casualties, which will presumably
be high. A tsunami watch is in effect for Hawaii.
A state of emergency has been declared at a nuclear power
plant but officials said there were no radiation leaks.
At least 60 people have been killed by the quake, which
struck about 400km (250 miles) north-east of Tokyo.
The death toll is expected to rise significantly.
Some reports quote Japanese police as saying 200 to 300
bodies have been found in the port city of Sendai.
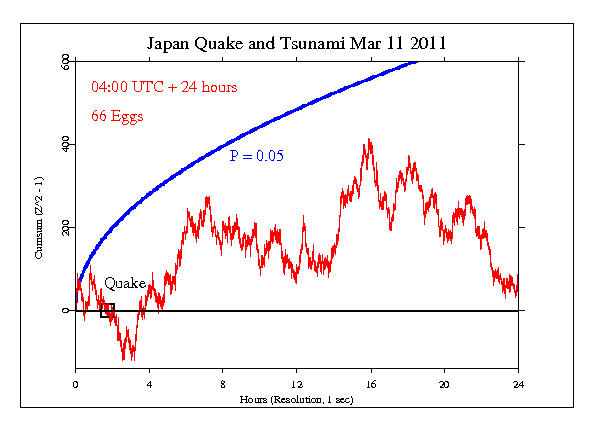
The GCP event was set for 24 hours beginning at 04:00 UTC on
11 March 2011. This includes a period prior to the
main temblor. The result is Chisquare 86487.371 on 86400 df,
for p = 0.416 and Z = 0.212.
Although our formal analysis is made using the full network
of 65-70 eggs, it is interesting to look at the data from
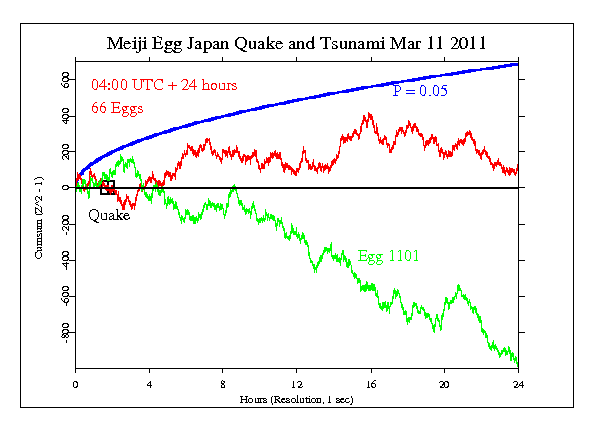
relatively local eggs. In this case, we have an egg in
Meiji, Japan, at Meiji University, ID# 1101. Examining the data from
this single device, we see a striking deviation away from
expectation beginning
around the time of the earthquake and persisting to the
end of the formally specified event. This is not a
formal analysis, but the departure amounts to -2.4 sigma, and
would happen about once in 100 randomly selected 24 hour days of data.
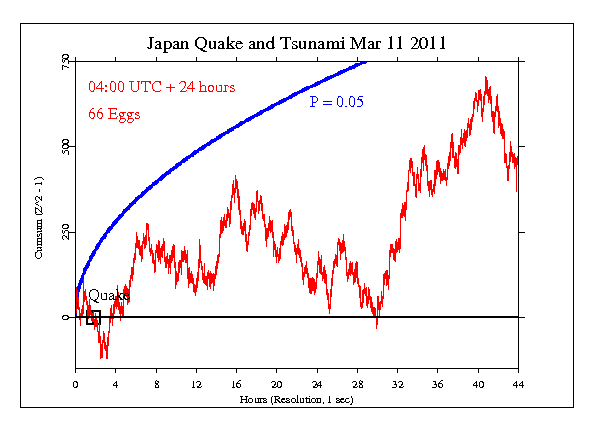
Given such a powerful event, with long-lasting effects as
the dimensions of the disaster become more clear, it is
worthwhile to look at a longer period of time. The next
figure shows another 20 hours. As we saw in the case of the
great tsunami in the Indian ocean in 2004, the longer view
shows a stronger response than we see in the
formal event period.
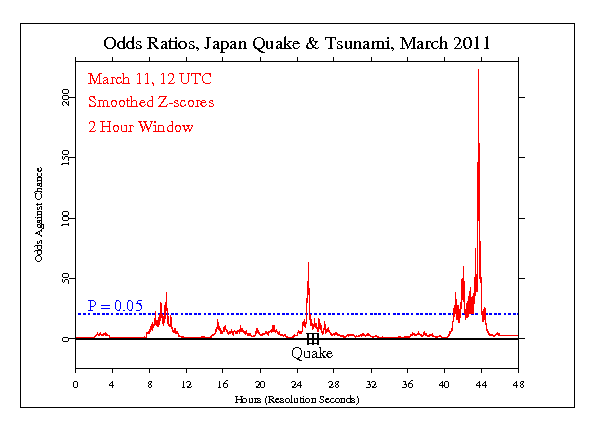
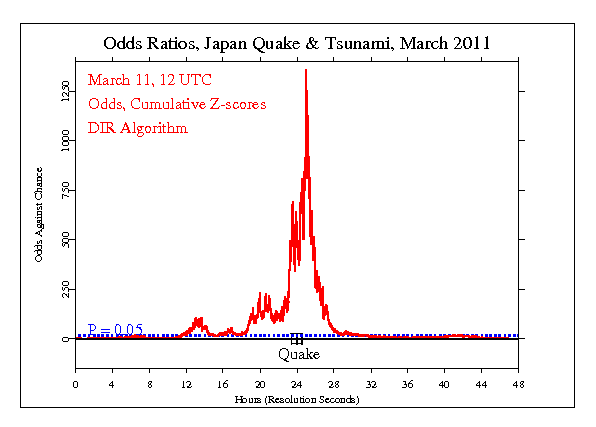
It is also useful to look at the data from a different perspective. The
next figure shows the odds ratios for the Z-scores over the two days
surrounding the main temblor. This procedure uses smoothing to identify
concentrations of large deviations. There is a spike at the time of the quake
with an odds ratio of about 70 to 1, but it is soon to be dwarfed.
As more time passes and the
magnitude of the disaster becomes more apparent, we see even greater
deviations in the data. The spike 15 or 20 hours after the quake first
hit has odds of nearly 250 to 1.
Here is a second way of visualizing the data around the quake, using a
method described by Dean Radin. It looks at the probability against
chance (as odds ratios) for the cumulative sum of Z-scores. This method
shows a huge weight of deviation near the time of the main temblor,
reaching odds of more than 1000 to one against chance.
It is important to keep in mind that we have only a tiny
statistical
effect, so that it is always hard to distinguish signal from
noise. This means that every "success" might be largely
driven by chance, and every "null" might include a real
signal overwhelmed by noise. In the long run, a real effect
can
be identified only by patiently accumulating replications of
similar analyses.
I don't generally try to explain why a result doesn't look
the way we would wish, but it may be useful in this case.
Many people have asked why the effect isn't commensurate with
the scale of the horrific event.
Part of the reason may be that natural disasters don't have
as strong effects as
human caused tragedies, especially at the beginning when
fear is the dominant emotion. Later, as compassion takes
over, we may see the predicted deviations. As described
above,
the effects are low level signals in a high noise environment, as
if we were looking for a goldfish surfacing amidst the
whitecaps of ocean waves.
Motivated by the questions, I have applied other analyses to
the data. The normal GCP statistic is the
Squared Stouffer's Z representing the network variance.
A natural question asks what happens to the unsquared Z, which
is effectively a measure of the average meanshift. The next
two figures show that measure. The first looks at the formal
event period, and can be compared to the first figure above.
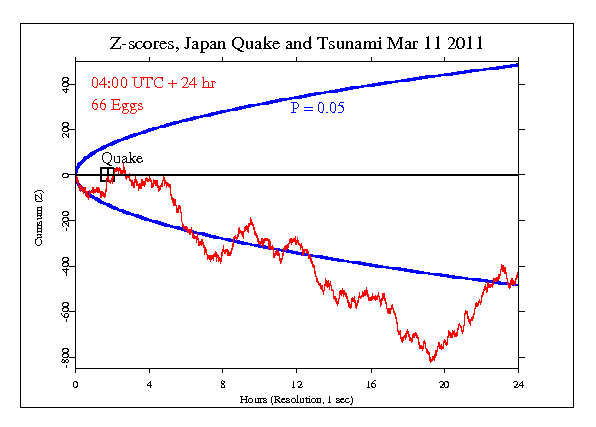
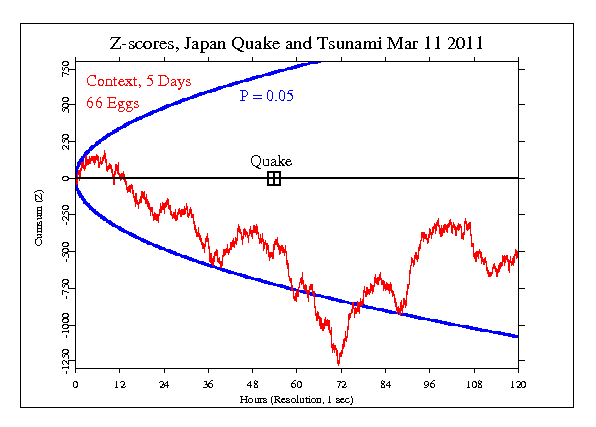
The second shows that same measure over a 5 day period
surrounding the quake. It looks like the downward trend
(that is, the persistent negative deviation of the mean
across the eggs) begins before the quake. We can't claim
this is a true precursor to the quake, but ... it may be
worth giving the question some attention.
Finally we look at the variance among the eggs, using a measure that
showed a striking shift during the terrorist attacks on September 11
2001. The figure shows the cumulative deviation of the device variance
from its theoretical expectation. The calculation is shown for 7
days of data beginning on March 9 2011, and the time of the huge quake
that caused the tsunami
on March 11 is marked. For comparison (since we have no normalized
statistical criterion) the data for 9/11 are shown using
the same calculation. It
is clear that the variance increased substantially beginning about
the time of the quake.

|