|
Bryan Williams has been doing independent analyses of various events
based on the 15-minute blocked data. He usually looks at the same
period as is specified in the formal prediction, and sometimes examines
longer periods around that time for context. In this page, I assemble
his analysis of the peace demonstrations on and then a
collection of analyses of the beginning and the end of the Iraq war. I
include his emailed description of his work.
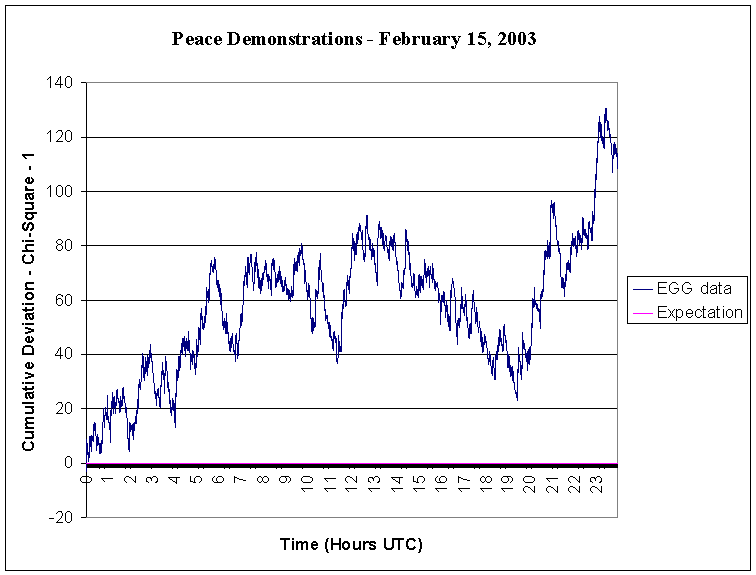
Peace Demonstrations Feb 15 2003
Dr. Nelson:
Here is the 15-minute block result for the global peace demonstrations
on February 15th. It is interesting that towards the end the trend takes
on a positive direction that is similar to the formal seconds result.
The result was found to have Chi-square = 4762.38, 4656 df, p = .135.
Regards,
Bryan Williams
The Beginning and the End of the War in Iraq
Dr. Nelson:
Attached are the graphical results for the events of the Iraq war in
15-minute resolution, as I had promised.
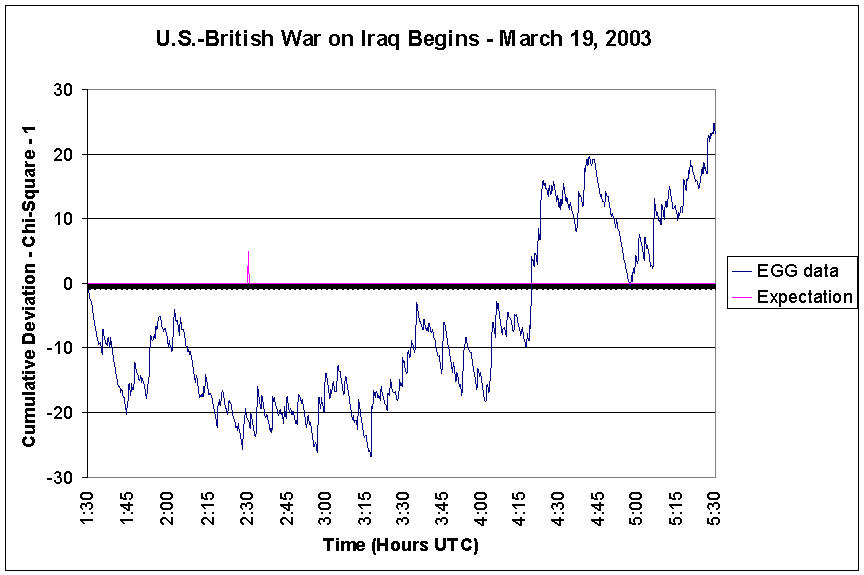
The first graph is one that I made using the preliminary prediction for
the start of the war that had initially been on the formal specification
registry around March 19. I was watching the news coverage of the events
that night in order to get exact times for them, and NBC News had
reported that the air raid sirens had started sounding in Baghdad (which
was assumed to be the beginning of the bombing by U.S. and British
warplanes) at around 9:30 PM EST (2:30 UTC), which is what is marked on
the expectation line. Since this was a makeshift prediction, I didn't
calculate a Chi-Square value for it, and create it just for a first look
at the data.
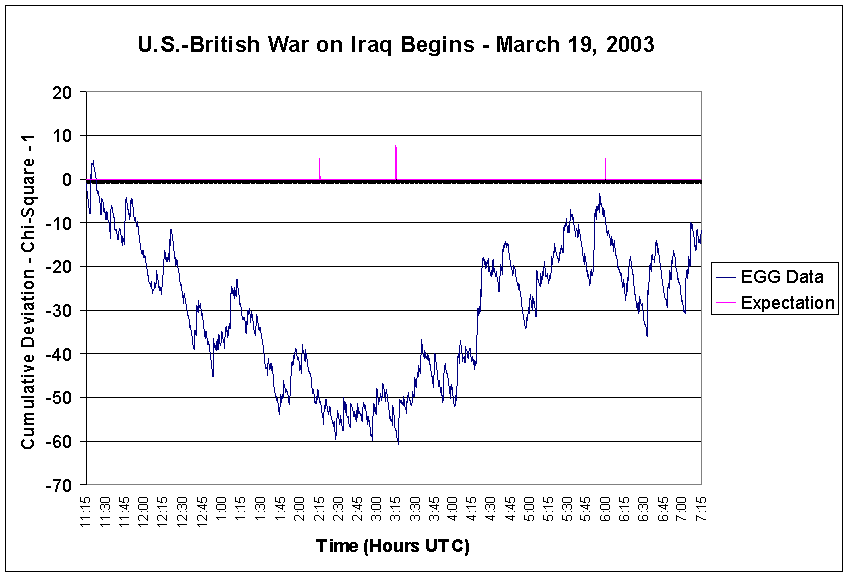
The second graph shows the formal prediction period in 15-minutes, which
has a trend quite similar to the seconds result. The first tickmark is
again the reported time of air raid sirens sounding, the second mark is
the time of President Bush's address to the nation, and the third is the
second wave of the Baghdad bombing. The results were a Chi-Square of
1495.46, 1507 df, p = .578.
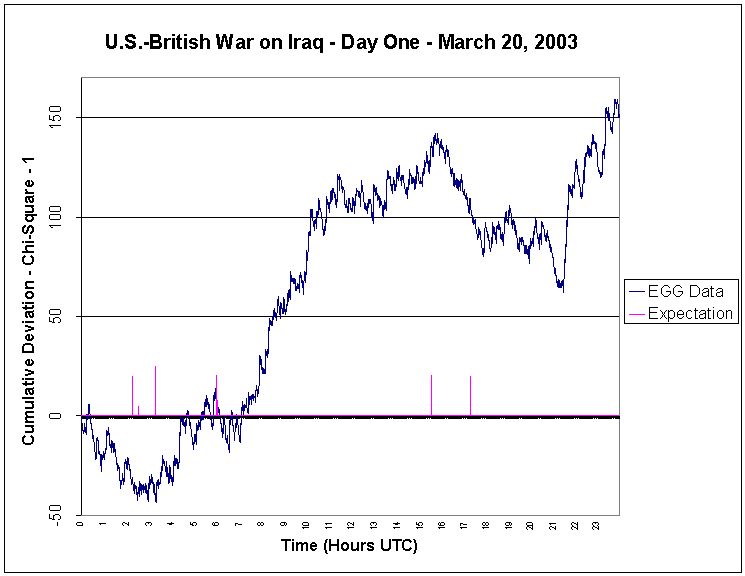
The third graph shows the first full day of the war in 15-minute
resolution, with the marked events on the expectation line being the
same as those on the seconds graph. From a visual standpoint I thought
the trend was very impressive, and if it were a formal prediction, it
would have had Chi-Square = 4632.7, 4483 df, p = .058.
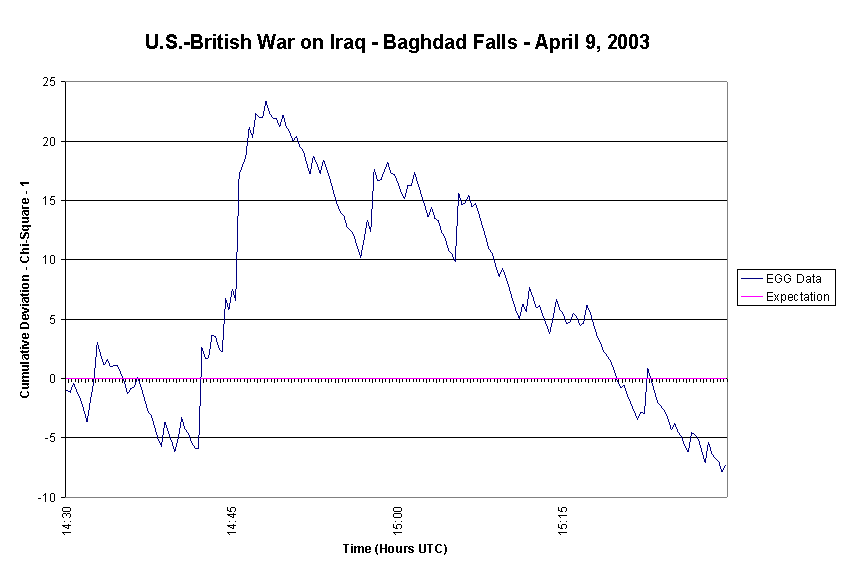
The fourth graph is for the formal prediction made for the end of the
war and the fall of the Saddam Hussein statue on April 9. From the
visual standpoint, I thought it was interesting how trend surrounding
the time of the Saddam statue falling seemed to be in line with Norm
Hirsh's idea of a "blip" in the data. The hour prediction resulted in
Chi-Square = 188.68, 196 df, p = .633.
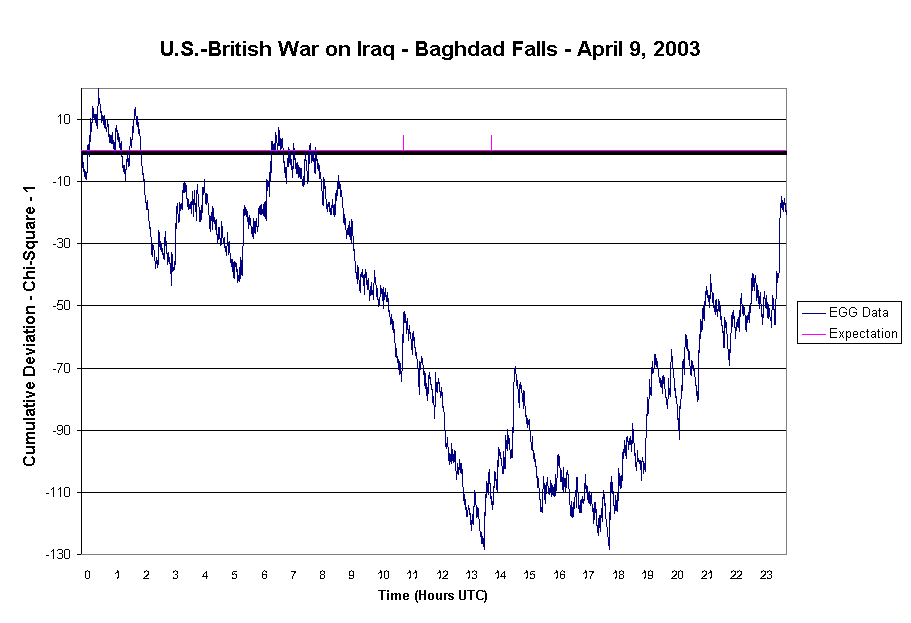
The last graph is the one I did the day following the fall of Baghdad on
April 9, which was a preliminary context exploration using a makeshift
prediction for the full UTC day. The first tickmark is the time reported
by NBC News as being the approximate moment U.S. troops entered Baghdad,
and the second marks the fall of the Saddam statue, which I had to
approximate at that time because I wasn't able to watch the full
coverage.
Sorry that these are coming so late; I was busy late in the semester and
was traveling during May.
Regards,
Bryan Williams, UNM
The End of the War; Saddam Falls
|